
Working Latina women in the United States face one of the largest wage gaps compared to non-Hispanic white men.
- In 2025, all working Latina women were typically paid $37,050 per year – just 53 cents for every dollar paid to white men.*
- While Latina women working full-time, year-round fare slightly better, typically paid 60 cents on the dollar, this figure excludes more than six million part-time and seasonal workers.*
The wage gap for Latina women demonstrates that our economy is designed to exploit working people, especially working women of color. The fact that a significant wage gap for Latina women workers persists even after accounting for differences in factors like education, occupation and immigration status reflect the consequences of structural sexism and white supremacy in the labor market and beyond.
Further, individual differences don’t exist in a vacuum – they are shaped by past laws and practices that systematically exploited and excluded Latina women by pushing them into service occupations that our economy depends on but does not value. The ongoing violence perpetrated by the Trump administration through Immigration and Customs Enforcement offers a deadly example of the barriers Latina women must contend with. Today, gender and racial discrimination, job segregation and lack of caregiving support policies drive down wages for Latina workers, who spend more time on unpaid caregiving than white or Black women. Discrimination is far from rare; more than half of Latina women have experienced racial (52 percent) or gender discrimination (54 percent).
Latinas and their families cannot afford lower wages
- Forty-five percent of Latina mothers are breadwinners for their families; their households rely heavily on their wages to make ends meet.
- Latina women are heads of household in nearly 3.8 million homes and more than 1 million of those families (27 percent) live in poverty.*
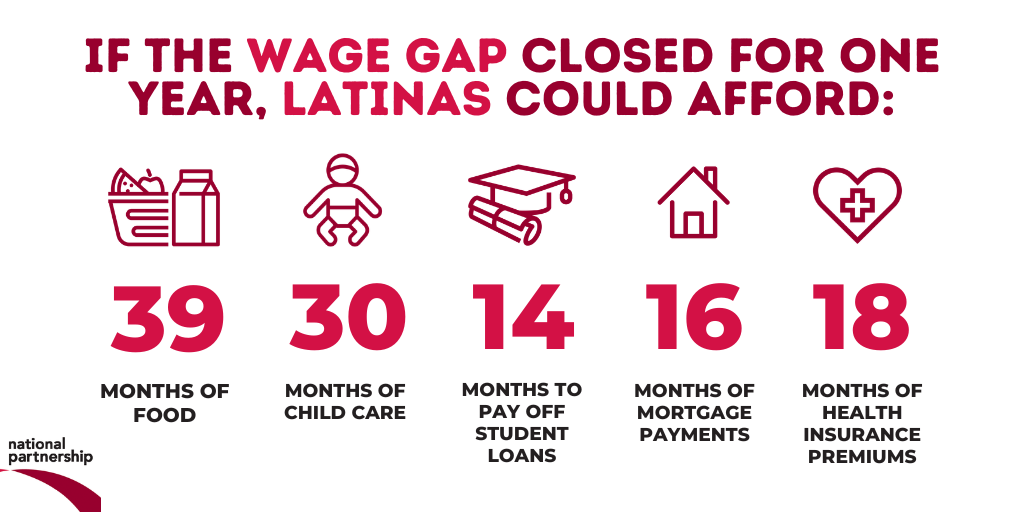
- If working Latina women did not lose $33,370 to the wage gap each year, they could afford any one of the following:*
- More than 39 months of food.
- More than 30 months of child care.
- More than 8,200 gallons of gas.
- More than 16 months of mortgage payments or nearly two years of rent.
- More than 18 months of health insurance premiums.
- Nearly three years of tuition and fees at a four-year public college, or more than four times the cost of tuition and fees for a two-year community college degree.
- To pay off their student loans in less than two years.
The wage gap for working Latina women varies by state
- Based on data from 2019 to 2023, Latina women face the largest overall cents-on-the-dollar wage gaps in Connecticut (just 39 cents for every dollar paid to white, non-Hispanic men), Michigan and Tennessee (40 cents each), and Maryland and Colorado (44 cents each).*
- California and Texas have the largest populations of Latina women working. Latina women in California are paid 57 cents for every dollar paid to white, non-Hispanic men while Latina women in Texas are paid 50 cents.
- The states with the smallest wage gaps between Latina women and white men are Massachusetts (69 cents), Washington state (64 cents) and Virginia and Pennsylvania (62 cents).
- Even in the states with the highest median wages for Latinas – New York ($33,288), Colorado ($33,250) and Massachusetts ($32,662) – wage gaps are still substantial.
Latina women want Congress to act
- Three-quarters (76 percent) of Latina women voters say strengthening equal pay laws is a very important policy concern.
- More than two-thirds of Latina women believe it is very important to provide paid family and medical leave (71 percent), provide paid sick and safe leave to heal from illness or seek safety from gender-based violence (69 percent), and expand access to affordable, high-quality child care (71 percent).
Our economy is designed to exploit working women. It’s set up so the powerful few get away with paying women low wages for essential work, making bigger profits by paying women less than men and allowing harassment and discrimination to push women out of the workforce. These problems are worse for Latina women.
But we can level the playing field to put people over profit. By raising the minimum wage, enforcing anti-discrimination laws to ensure equal pay for equal work, and ensuring all workers have work-life family supports like paid family and medical leave and paid sick leave, we can build an economy that works for all. Now is the time to act.
Method Note
Unless explicitly cited, all data in this factsheet are the author’s original analysis. Wage gap calculations compare median earnings for working Latina women to non-Hispanic white men, and unless explicitly stated includes part-time and seasonal workers. Latinas may be of any race. Median annual earnings for non-Hispanic white men in 2025 were $70,420. Overall earnings and population estimates are from the Current Population Survey, Annual Social and Economic (ASEC) Supplement: Table PINC-05: Work Experience in 2025 – People 15 Years Old and Over by Total Money Earnings in 2025, Age, Race, Hispanic Origin and Sex. In 2025 there were 16,520,000 Latina workers with earnings, including 10,480,000 full-time, year-round workers. State median earnings and population estimates are from the American Community Survey 5-Year Estimates 2019-2023, Geographies: All States within United States: Tables B20017I, B20017H, and B20005I. The number of Latina headed family households is the number of family households headed by Latina women with no spouse present from the American Community Survey 1-Year Estimates 2024, Table B1101I: Household Type (Including Living Alone) (Hispanic or Latino). Poverty estimates for Latina headed family households based on author calculation using American Community Survey 1-Year Estimates 2024, Table S0201: Selected Population Profile in the United States (Hispanic or Latino).
The cost of the wage gap for Latina women divides the dollar amount of the wage gap for all working Latina women ($33,370) by the following average cost data to determine equivalent costs: Child care: 30.4 months of child care for Latina women using the national average price for center-based care for a four-year-old in 2025 ($13,184) from Child Care Aware of America (2025). Child Care in America: 2025 Price and Supply. Food: 39.4 months using overall average “food” expenditure ($10,169) in 2024 from U.S. Bureau of Labor Statistics. (2025, December 19). Consumer Expenditures – 2024. Gas: 8,230 gallons of gas using the national weekly average price of regular gasoline from August 3rd to 24th, 2026 ($4.05 per gallon) based on authors’ calculation from U.S. Energy Information Administration (2026, August 22). Gasoline and Diesel Fuel Update: Regular Gasoline Prices All Areas All Formulations: Full History XLS. Mortgage and rent: 16.4 months of mortgage payments using median monthly owner costs for housing units with a mortgage in 2024 ($2,035) or 22.4 months of rent using median monthly gross rent of occupied units in 2024 ($1,487) from the U.S. Census Bureau (2025). American Community Survey 1-Year Estimates 2024, Table DP04: Selected Housing Characteristics. Health insurance: 18.4 months of premium payments using the national average monthly employee contribution to employer-sponsored health insurance premiums in 2025 ($1,817) from the U.S. Agency for Healthcare Research and Quality. (n.d.) Medical Expenditure Panel Survey Insurance Component: Table X.C.1: Employee contribution distributions (in dollars) for private-sector employees enrolled in single coverage at the 10th, 25th, 50th (median), 75th and 90th percentiles, private-sector by State: United States, 2025. Higher education: 2.8 years of a four-year, in-state public college or university using average total annual cost of undergraduate tuition and required fees ($11,950) or 8 years of tuition and fees at a two-year in-district state college in 2025 ($4,150) from Ma, J., Pender, M., & Hu, X. (2025). Trends in College Pricing and Student Aid 2025: Table CP-1. College Board. Student loans: 14.2 months to pay off using average loan balance for recipients of direct loans as of Q4 2025 ($39,614), based on authors’ calculations from the U.S. Department of Education Office of Federal Student Aid. (n.d.) Federal Student Loan Portfolio: Federal Student Aid Portfolio Summary.