
Native peopleMeasuring Native identity is a complex and nuanced process. Measures of Native people as a racial group, which rely on self-reporting and connection to community, differ from legal definitions of Tribal enrollment for a range of reasons including recognition of Tribes by the U.S. government and enrollment rules specific to different Tribes. Whenever possible, researchers should consult Native advocates, Tribes and scholars who are the experts on this issue. For more information, see National Congress of American Indians, “Data Disaggregation.” Many Native communities prefer to include individuals who report one or more races for Native population estimates – often referred to as American Indian and Alaska Native (AIAN) Alone or in Combination (AOIC) in federal data. This fact sheet uses both AIAN Alone and AIAN AOIC as data availability allows; see method note for full information. are the original stewards of the land that now makes up the United States, but Native women face one of the largest gender wage gaps of any racial or ethnic group.
- In 2025, Native women were typically paid $35,417 per year – just 57 cents for every dollar paid to white men.*
- While Native women working full time, year-round fare slightly better, typically paid $48,545, or 62 cents on the dollar, this figure excludes nearly 40 percent of Native women workers (those who work part time or seasonally).*
- In 2024 alone, Native American women collectively lost approximately $37 billion to the wage gap.*
The legacy of hundreds of years of settler colonialism, genocide and forced migrations continue to shape the economic inequality and insecurity faced by Native communities. The wage gap experienced by Native women is shaped by policy choices that allow the powerful few to get away with paying women low wages for essential work; making bigger profits by paying women less than men; and allowing harassment, discrimination and lack of caregiving support to push women out of the workforce.
Native women and their families cannot afford lower wages
- As of 2023, 56 percent of Native mothers are breadwinners for their families.
- Native women are heads of household in more than 647,000 family homes, and more than 163,000 (25 percent) of these families live in poverty.*
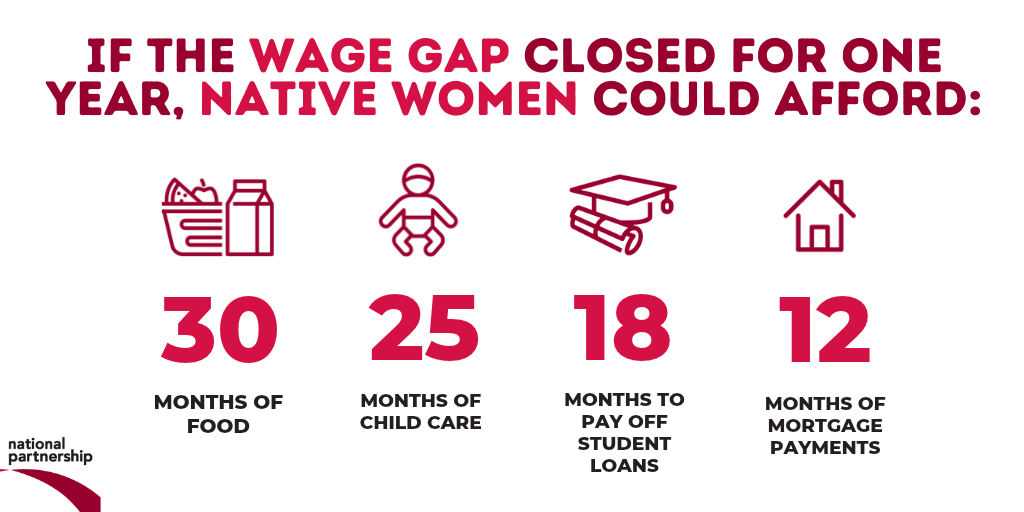
- If Native women did not lose $26,940 to the wage gap each year, they could afford any one of the following:*
- Thirty months of food.
- Twenty-five months of child care.
- More than 6,600 gallons of gas.
- Twelve months of mortgage payments or more than 17 months of rent.
- More than two years of tuition and fees at a four-year public college, or more than three times the cost for a two-year community college degree.
- To pay off their student loans in less than two years.
Across states, the wage gap threatens Native women’s economic security
- Native women in Rhode Island experience the largest wage gap, typically paid as little as 27 cents on the dollar compared to white men. But Rhode Island is not an outlier; Native women are typically paid less than 50 percent of what white men are paid in more than a quarter of states.*
Policy change can close the wage gap for Native women
- Our economy is designed to exploit working women. Job segregation, racial and gender discrimination, and lack of caregiving policies drive down working women’s wages and keep other women out of the workforce entirely. Native women voters know this: 67 percent say the economy and cost of living is a top issue.
- We can close the wage gap by enacting policies that level the playing field and put people over profit.
- Native women voters overwhelmingly support strengthening equal pay laws and ensuring workplaces are free from harassment and discrimination (94 and 95 percent, respectively), expanding access to child care (95 percent) and ensuring all workers have access to paid family leave (95 percent) and paid sick leave (90 percent). Now is the time to act.
Method Note:
Wage gap calculations compare median earnings for American Indian and Alaska Native women aged 16 and older with earnings in the past 12 months who report one race, including those who identify as Latina, to non-Hispanic white men. Workers are considered full-time, year-round if they worked 35 hours or more per week for 50 weeks or more last year. Median earnings and working population estimates nationally and by state: 2025 American Community Survey (ACS) 1-Year Estimates: Table B20017C (AIAN Alone) and Table B20017H (Non-Hispanic White). Percent of AIAN women working part time or seasonally: based on author calculation using 2025 ACS 1-Year Estimates: Table B20005C. In 2025, there were 943,851 AIAN Alone women with earnings, 37.9 percent of whom worked part time or seasonally. Total dollars lost to the wage gap each year: based on author calculation using 2024 ACS 1-Year Estimates via IPUMS USA multiplying the wage gap in mean earnings between AIAN Alone women and non-Hispanic white men ($45,779) by the total number of AIAN Alone women with earnings in 2024 (811,639). Native women-headed family household estimates and poverty rates: based on author calculation using 2025 ACS 1-Year Estimates: Table S0201 for AIAN AOIC households, female householder, no spouse present, family.
The cost of the wage gap divides the wage gap for all AIAN Alone women workers with earnings ($26,940) by average national cost data. Child care: average price for center-based care for a four-year-old in 2025 ($13,184) from Child Care Aware of America. (2026, May). Child Care in America: 2025 Price & Supply. Food: average “food” expenditure ($10,663) in 2025 from U.S. Bureau of Labor Statistics. (2026, October 29). Consumer Expenditures – 2025. Gas: author calculation of weekly average price of regular gasoline from August 3 to 24, 2026 ($4.05 per gallon) using U.S. Energy Information Administration. (2026, August 22). Gasoline and Diesel Fuel Update: Regular Gasoline Prices All Areas All Formulations: Full History XLS. Mortgage and rent: median monthly owner costs for housing units with a mortgage in 2025 ($2,163) and median monthly gross rent of occupied units in 2025 ($1,557) from the U.S. Census Bureau. (2026). American Community Survey 2025 1-Year Estimates: Table DP04. Higher education: average total annual cost of undergraduate tuition and required fees at a four-year, in-state public college ($11,950) and at a two-year in-district state college ($4,150) in 2025-26 from Ma, J., Pender, M., & Hu, X. (2025). Trends in College Pricing and Student Aid 2025: Table CP-1. College Board. Student loans: author calculation of average loan balance for recipients of direct loans as of Q4 2025 ($39,614), using U.S. Department of Education Office of Federal Student Aid. (n.d.). Federal Student Loan Portfolio: Federal Student Aid Portfolio Summary.
Acknowledgements: Thank you to Robert Maxim, Shannon Bonney, Sarah Jane Glynn, Katherine Gallagher Robbins, Sharita Gruberg and Gail Zuagar for their contributions.